Service and infrastructure monitoring with Uptime Kuma - Part 1
Discover how UptimeKuma, an open-source and self-hosted uptime monitoring tool, empowers you to stay ahead of server or service failures.
Part 2 is available here
Migration guide for UptimeKuma is here
Service and infrastructure monitoring with Uptime Kuma - Part 1
From time to time servers or services might fail, and as a selfhoster you need to know when that happens. Uptime Kuma is one of those extremely helpful apps that will you know when such a thing happens. It is (as the name suggests) and uptime monitoring tool that can help you. Uptime monitoring can also help you understand if a platform or an app you are subscribing to are fulfilling their SLA (Service Level Agreement); and Uptime Kuma does that extremely well.
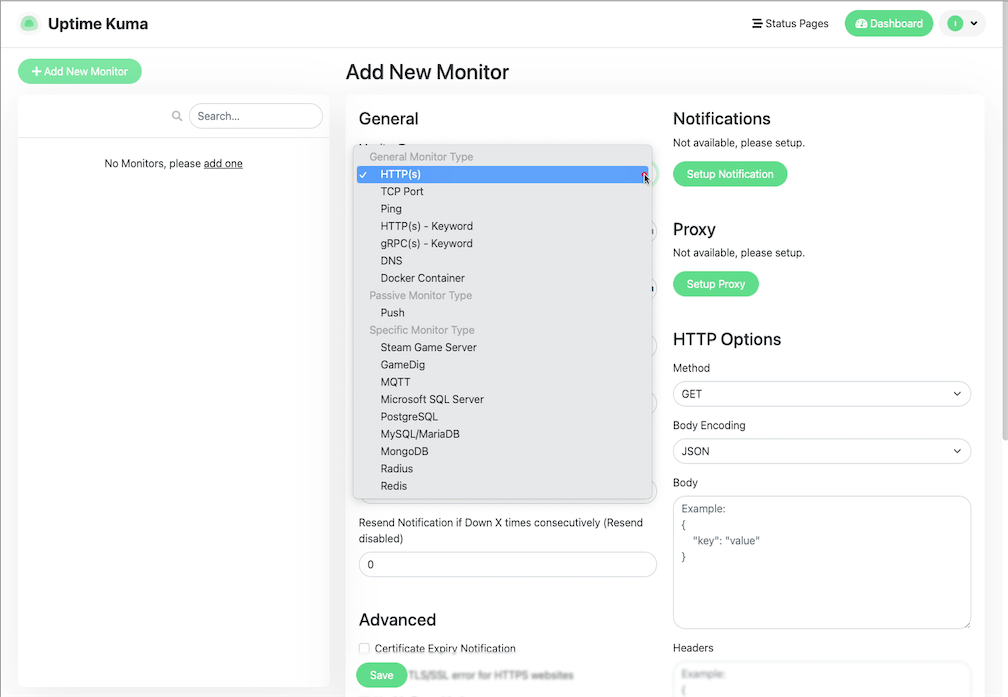 The various monitors offered by UptimeKuma
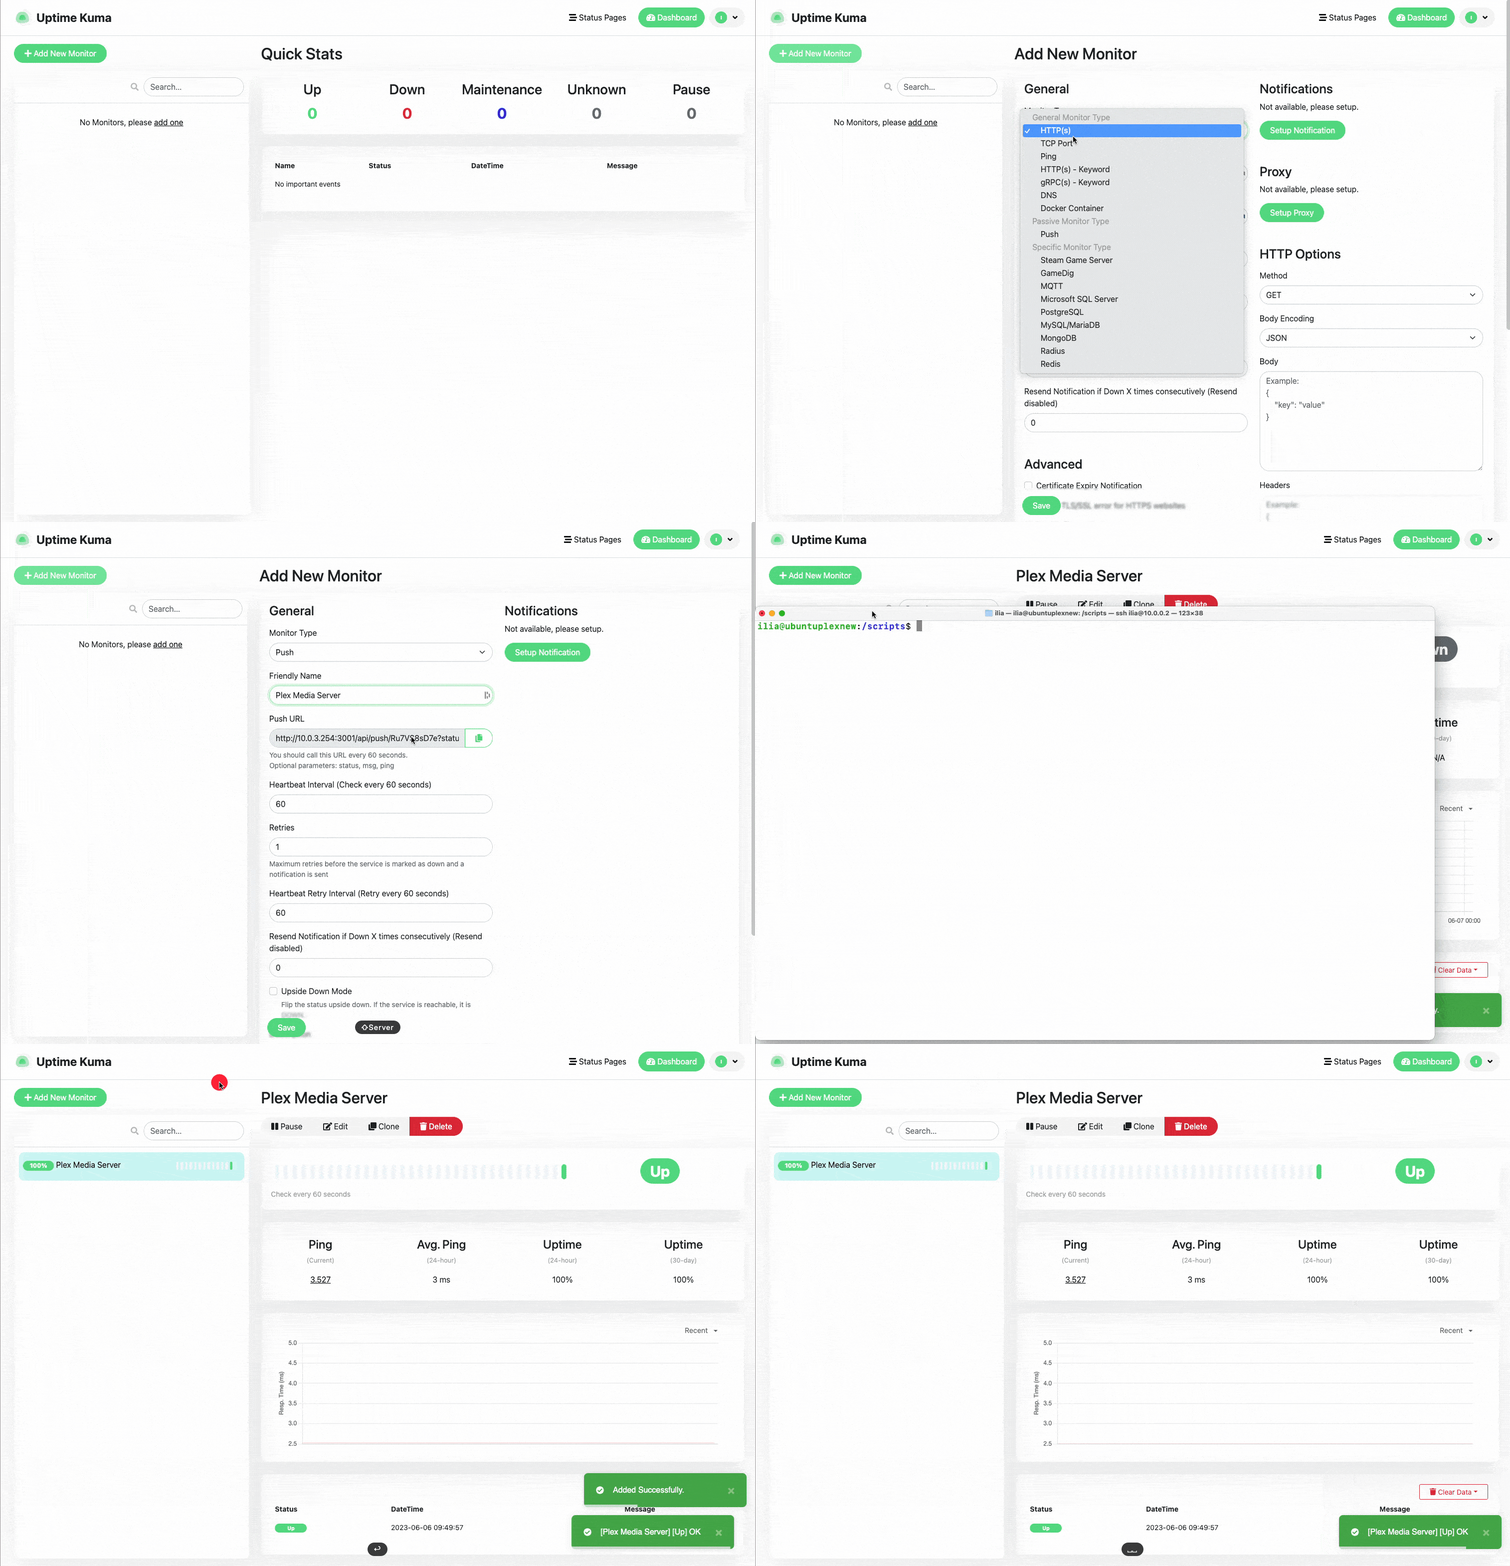
HTTP(S) Monitor: This is probably the most common type of monitor you’ll be using. This monitor checks the status of a web service by sending a HTTP or HTTPS request to a specified URL. You can configure it to consider a certain HTTP status code (like 200 OK) as “up,” and any other code as “down.” You can also set up advanced options like request method (GET, POST, etc.), custom headers, and expected response body as well as certificate monitoring.
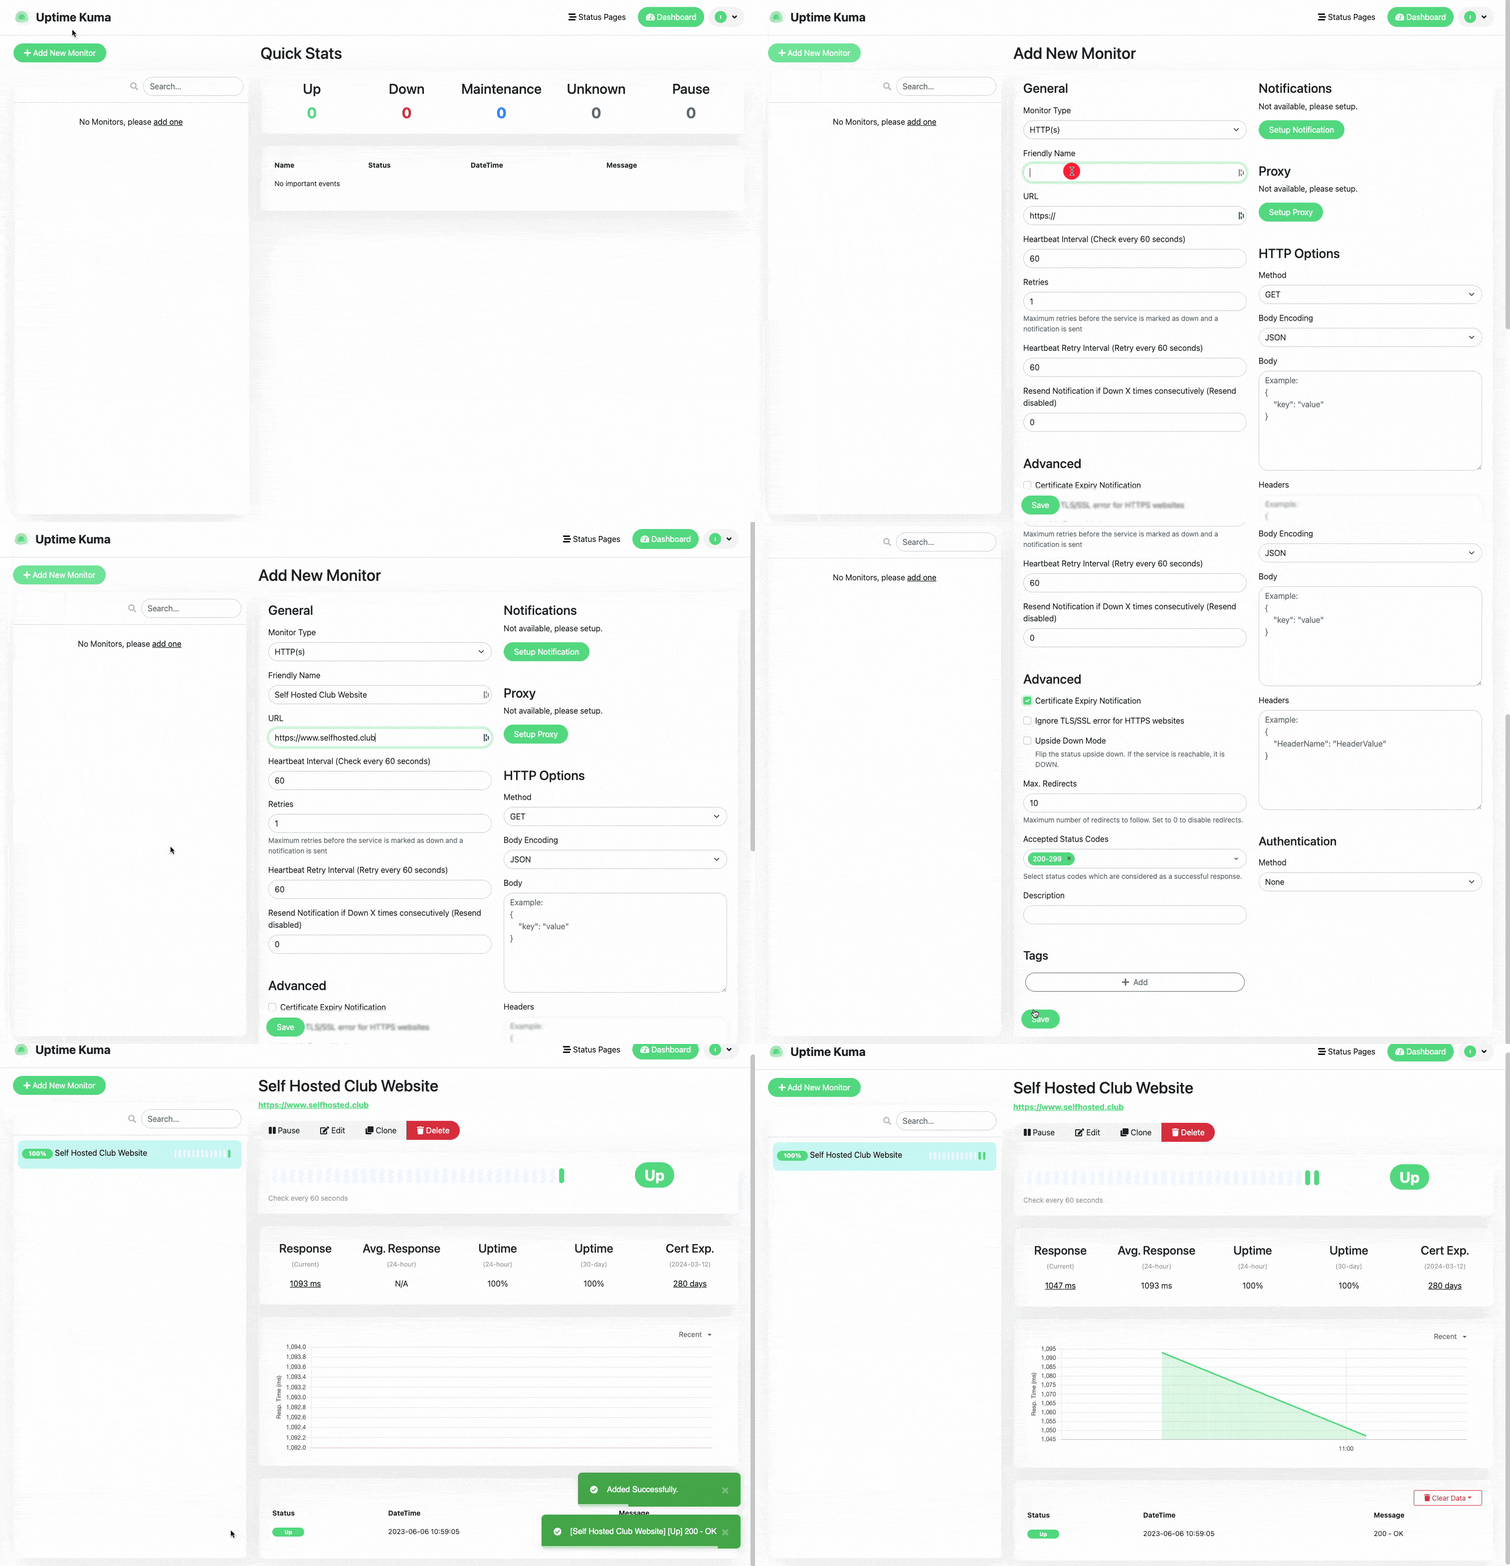 UptimeKuma HTTP Monitor walkthrough
Some links may be affiliate links that keep this site running.
TCP Monitor: This monitor is used to check the status of a TCP service, such as a database or email server. You specify the IP address or hostname and the port number, and Uptime Kuma will try to establish a TCP connection. If the connection is successful, the service is considered “up,” otherwise, it’s “down.”
Ping Monitor: This monitor sends an ICMP “echo request” (also known as a ping) to an IP address or hostname. If it receives an echo reply, the host is considered “up,” otherwise, it’s “down.” This monitor is useful for checking the status of network devices like routers and switches.
DNS Monitor: This monitor checks the status of a DNS server by making a DNS query to a specified domain. If it gets a valid DNS response, the server is considered “up,” otherwise, it’s “down.”
HTTP(s) Keyword Monitor: This monitor is similar to the HTTP(S) monitor, but instead of checking the HTTP status code, it checks the response body for a specific keyword or phrase. If the keyword is found, the service is considered “up,” otherwise, it’s “down.” This can be useful for checking if a web service is not just responding, but responding correctly.
gRPC(s) - Keyword: The gRPC keyword monitor is a proposed feature in Uptime Kuma that aims to enable monitoring of internal services that only support the gRPC protocol.
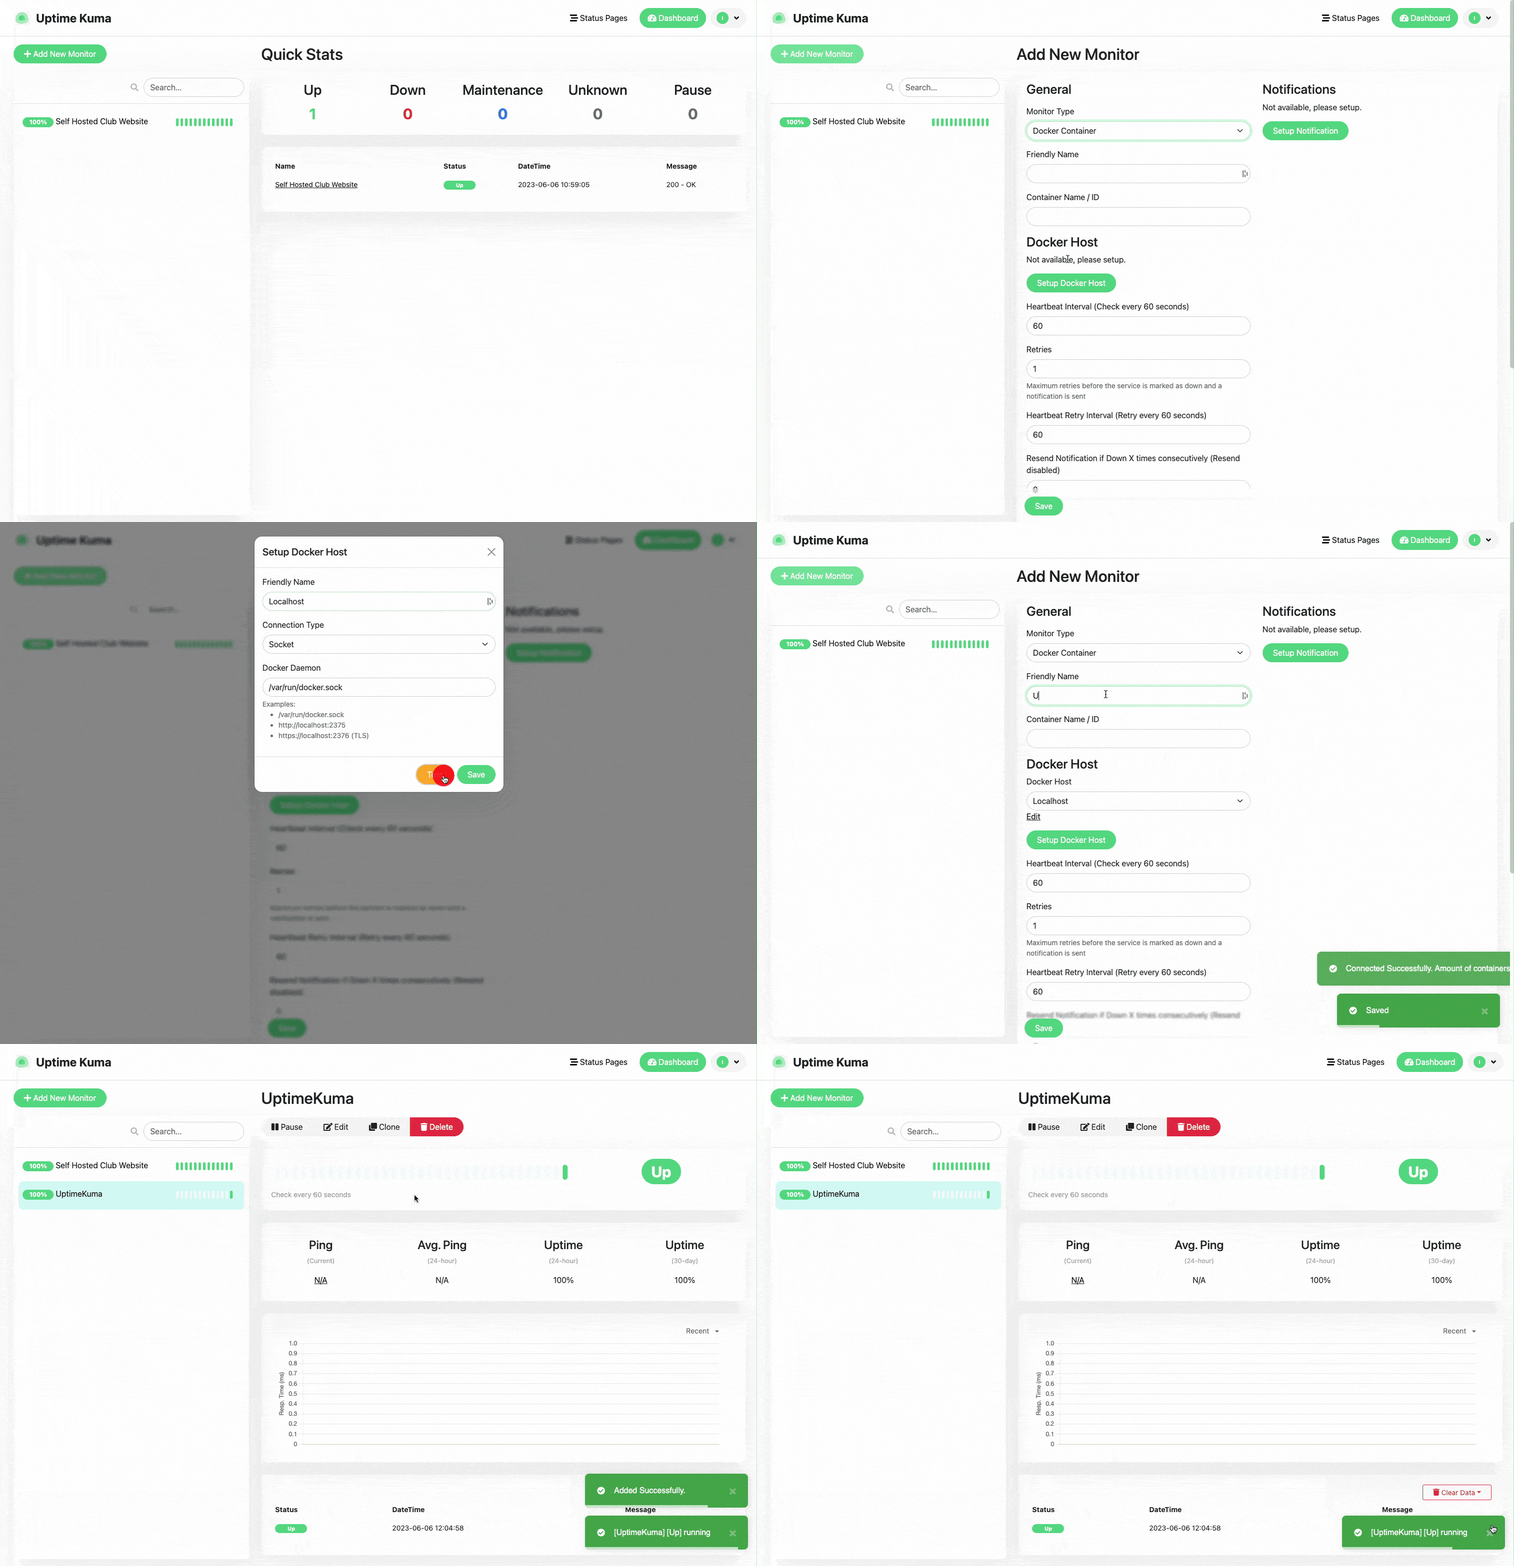
Docker container: This monitor allows you to monitor the status of docker containers by connecting to the docker host either through the socket (which you’ll need to expose) or through the web service Docker can be configured for monitoring.
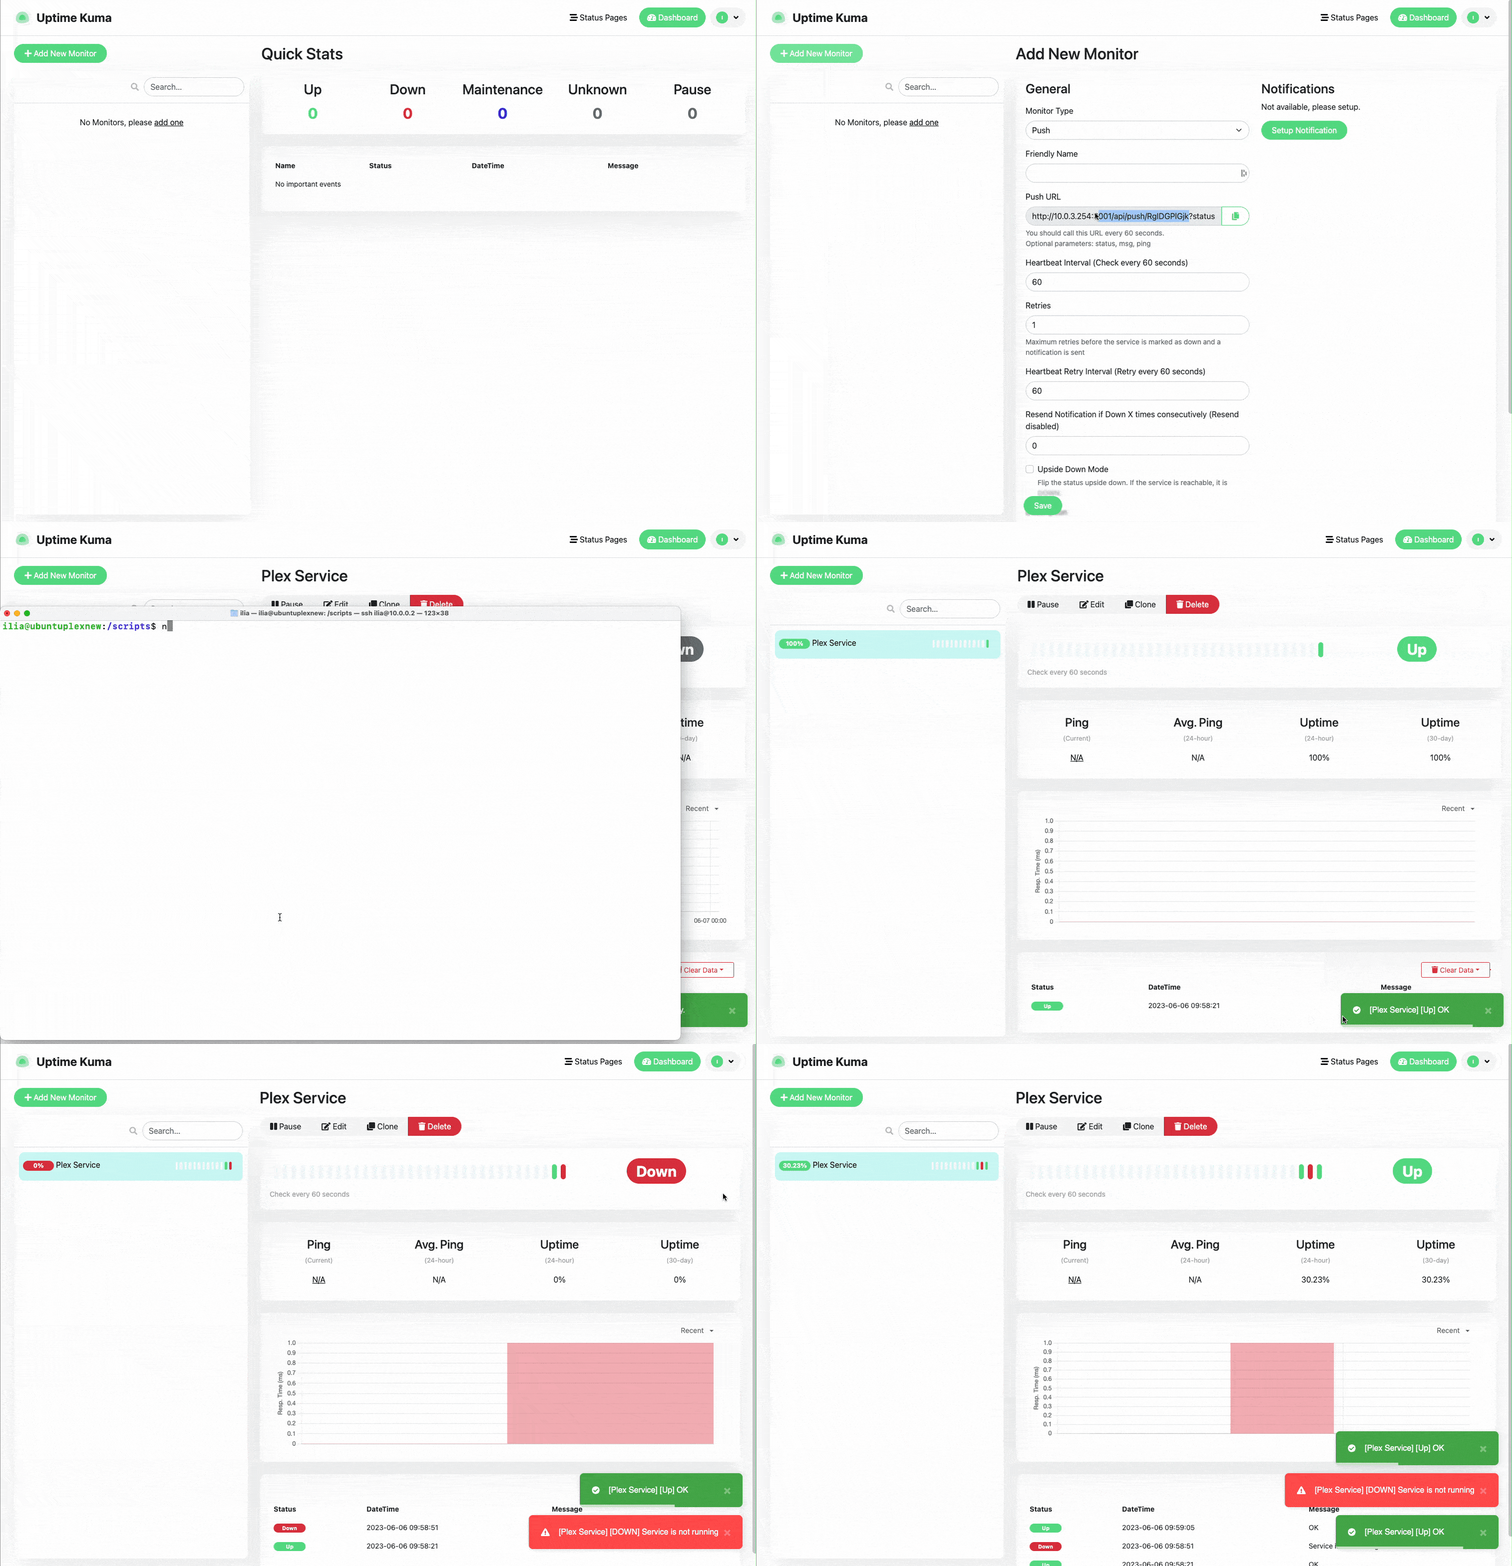
Push: This is probably one of my favourite monitors and it is a passive one, it creates a listener on Uptime Kuma and waits for a call; you can customise the messages and and add other info it. If you are familiar with healthchecks.io, you can achieve something similar here.
What I have found through the years of working with various devices is that a device can still respond to ping as the network stack is still up and available, it is in actuality frozen on the OS level. Because of that my preference is to use push monitors when I am able to. You can see the example below.
Here is the code for the shell script to push back a ping of the server as well, you will need to install jq first to work a bit easier with JSON data:
Install jq:
1

sudo apt install jq
Create a script file such as healthcheck.sh and paste the code below to it, you can run that or create a cron for that.
1
2
3
4
5
6
7
8
9
10
11
12
13
14
15
16
17
18
19
20
21
22
23
24
25
26
27

#!/bin/bash

# Define the URL for the curl command
url="<your url here up to the ? mark>"
#Test IP to run the PING command against
test_ip="1.1.1.1"

# Execute the ping command and capture the output
ping_output_rtt=$(ping -c 1 $test_ip | awk '/rtt/ {print $4}' | cut -d '/' -f 2)
ping_output_round_trip=$(ping -c 1 $test_ip | awk '/round-trip/ {print $4}' | cut -d '/' -f 2)

# Use whichever output is not empty
if [ -z "$ping_output_rtt" ]
then
    ping_output=$ping_output_round_trip
else
    ping_output=$ping_output_rtt
fi

# URL-encode the ping output
encoded_ping_output=$(printf "%s" "$ping_output" | jq -s -R -r @uri)

# Construct the complete curl command with the ping value
curl_command="curl -m 10 --retry 5 '${url}?status=up&msg=OK&ping=${encoded_ping_output}'"

# Execute the curl command
eval "$curl_command"
Another interesting thing you can do if you change the script a bit, and create a service monitoring script for various services you run and might want to monitor.
Here is the code for the service monitoring script:
1
2
3
4
5
6
7
8
9
10
11
12
13
14
15
16
17
18
19
20
21
22
23
24
25
26
27
28

#!/bin/bash

# Define the URL for the curl command
url="<your url here up to the ? mark>"

# Define the service name
SERVICE_NAME="<The service name as it is under systemd>"

# Check the status of the service
if systemctl is-active --quiet "$SERVICE_NAME"
then
    # If the service is running, set the status to 'up' and the message to 'OK'
    status="up"
    msg="OK"
else
    # If the service is not running, set the status to 'down' and the message to 'Service is not running'
    status="down"
    msg="Service is not running"
fi

# URL-encode the message
encoded_msg=$(printf "%s" "$msg" | jq -s -R -r @uri)

# Construct the complete curl command with the status and message
curl_command="curl -m 10 --retry 5 '${url}?status=${status}&msg=${encoded_msg}'"

# Execute the curl command
eval "$curl_command"
The rest of the monitors are very specific and well… quite self explanatory, we will document and record those in future.
The use of tags in Uptime Kuma
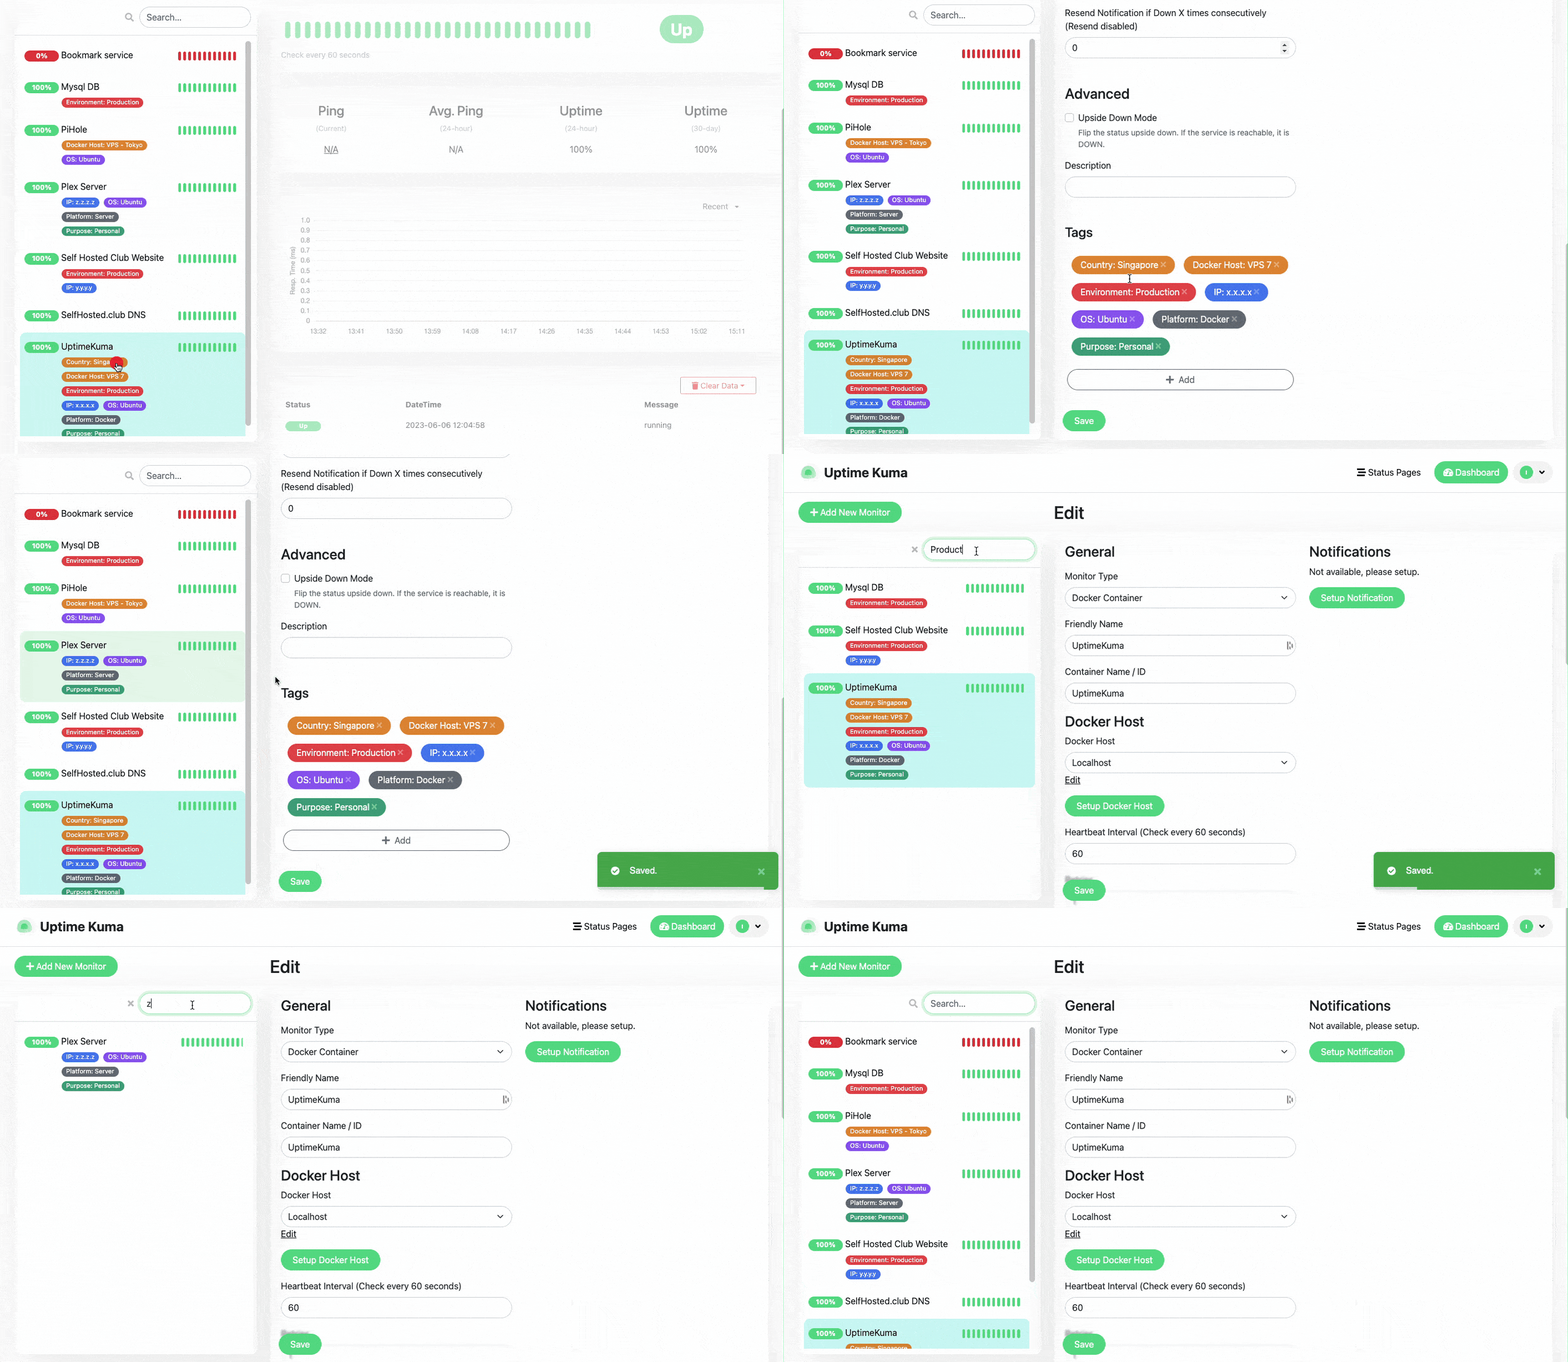
You have the possibility to assign tags to your monitored assets, while it is a great functionality, it is a bit cumbersome on how the assignment happens. Each and every asset has to be manually edited and assigned tags; Later though you are able to use those to filter your assets in the search if you have many of those - after some time, you will have quite a few assets and services being monitored and so it is highly recommended to use tags.
Status pages
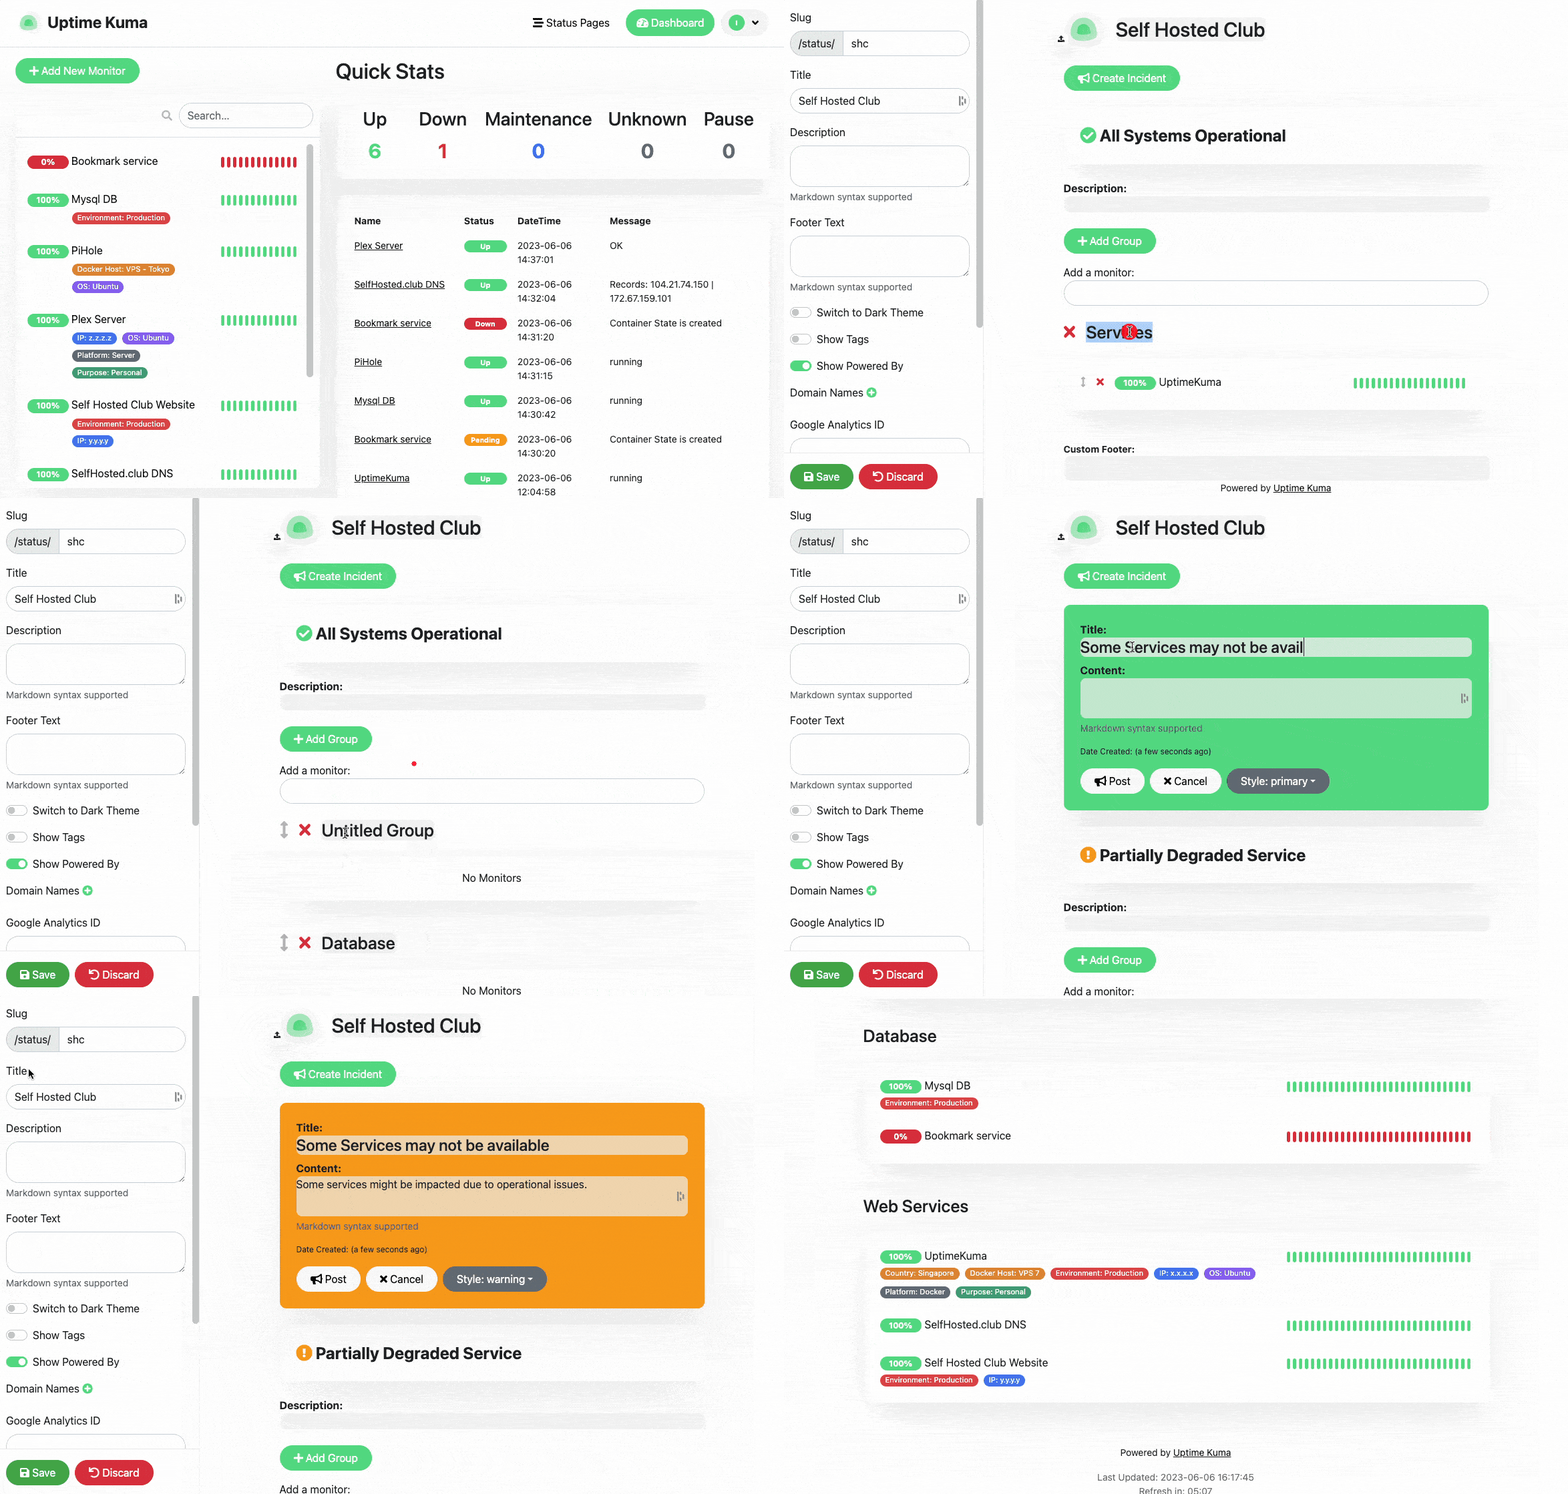
We will finish this post with status pages, which are a valuable feature in Uptime Kuma that allow users to share the status of their monitored services publicly. Essentially, they are public-facing web pages that provide real-time information about the uptime and availability of your services. Status Pages can be customised to show the services you want, making it a fantastic tool for transparency and communication with your user base.
You can customise it showing your tags if these are internal pages, assign domain url to the page, custom CSS and Google analytics; the status will automatically change according to the signals received from your monitors.
A few notes
I do recommend to choose a highly available host for Uptime Kuma so you may get notifications in a timely matter, for some monitors you’d might want to run those over an encrypted network such as Wireguard, OpenVPN or our favorite NetBird (which runs wireguard).
Wrapping up
We will continue with another post on a few more details we did not touch upon right now such as the specific service monitors, notification setups, reverse proxies, cloudflare tunnel and using the API of Uptime Kuma.
I hope this was beneficial, and does help you get started with Uptime monitoring, do subscribe to get new articles to your email.
Click here to read part 2

